Economic risk drove second-quarter stability deterioration and is likely to remain the primary risk vector in the second half of the year
Intelligence requirement
Janes Country Stability Indicators (CSI) quantify socio-political risk across countries using political, social, economic, and external factors. Updated quarterly, the indicators provide a comparative basis for assessing changes in global stability risk.
This report examines risk-rating changes between Q1 and Q2 2026, identifies the principal drivers of those changes, highlights countries with material shifts in risk profile, and assesses broader global trends in quantified stability risk.
Assessment
Global internal risk (the extent to which domestic political, social, and economic pressures threaten a state’s stability) was superficially unchanged in Q2 2026, with the average score remaining unchanged from the prior period at 1.84 (low bordering on moderate risk). This headline stability masked a shift in the composition of risk: political and social risk eased, while average global economic risk increased from 1.73 to 1.78, remaining within the low-risk band.
The deterioration was broad-based across the CSI economic sub-indicators, including unemployment, GDP, inflation, and currency and deficit risk. The largest movement was in currency and deficit risk, which increased by 0.10 on average, followed by unemployment risk, which rose by 0.04. This was indicative of a primarily fiscal, currency, and labour-market deterioration, reinforced in some countries by inflationary pressure, GDP volatility, and weaker growth.
The broad minor deterioration in economic risk at the global level however is composed of several substantial economic risk increases across Q2 206 for countries like Iraq and those across Sub-Saharan Africa.
Economic degradation
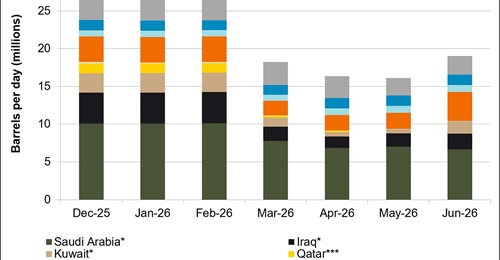
Strait of Hormuz disruption that began in Q1 2026 acted as a catalyst for change in the second quarter (Q2), amplifying pre-existing economic vulnerabilities linked to the post-Covid fiscal burden, the inflationary legacy of the Ukraine war, elevated debt-servicing costs, and limited state policy space (notably relating to fiscal measures).
The most immediate transmission channel was hydrocarbons. Disrupted or threatened oil and gas flows raised industrial input costs and likely sustained global inflationary pressures.
Exposure was highest among energy-import-dependent economies, particularly in Asia, although the stability effect varied according to import dependence, subsidy regimes, foreign-exchange reserves, fiscal space, and pre-existing risk levels.
The impact goes beyond energy alone. Disruption to fertiliser markets created additional pressure on agriculture-reliant and food-insecure economies, especially in parts of Sub-Saharan Africa and Asia. Higher fertiliser and fuel costs can weaken agricultural output, raise food prices, and increase food-import requirements, with the greatest stability implications for states already facing fiscal, food-security, or external-balance pressures.
More broadly, the deterioration in economic risk reflects the interaction of the Strait of Hormuz supply shock with wider macroeconomic pressures: elevated input costs, persistent inflation, currency and external-balance pressure, higher sovereign financing costs, and constrained state capacity to respond after successive periods of disruption.
Greater economic instability is weighted towards countries with pre-existing economic vulnerabilities – fully 79% of countries that had an economic risk rating of moderate or above during Q1 experienced a degradation in outlook (heightened risk) compared with 68% of those with low or very low preexisting risk ratings.
Economic risk associated with Sub-Saharan African countries increased 5% overall with the highest increases applicable to Mozambique (rising from 2.67 – moderate risk to 3.12, high risk); Niger (2.09 to 2.37 – moderate risk), Madagascar (2.21 to 2.43 – moderate risk), and Malawi (2.99 to 3.20 – high risk).
Overall internal stability
Worsened outlook
| Rank | Country | Q1 2026 internal stability rating | Q2 2026 internal stability rating | % change (quarter on quarter | Q2 2026 risk interpretation |
| 1 | Bahrain | 1.54 | 1.78 | 0.16 | Low risk |
| 2 | Niger | 2.55 | 2.8 | 0.1 | High risk |
| 3 | South Africa | 2.21 | 2.42 | 0.09 | Moderate risk |
| 4 | Kuwait | 1.43 | 1.58 | 0.11 | Low risk |
| 5 | Mozambique | 2.88 | 3.02 | 0.05 | High risk |
| 6 | Malawi | 2.34 | 2.47 | 0.06 | Moderate risk |
| 7 | Cuba | 1.78 | 1.91 | 0.07 | Moderate risk |
| 8 | Samoa | 1.26 | 1.38 | 0.1 | Low risk |
| 9 | Burkina Faso | 2.84 | 2.95 | 0.04 | High risk |
| 10 | Serbia | 1.83 | 1.94 | 0.06 | Moderate risk |
| Source: Janes (Country Stability Indicators) | |||||
Table showing internal stability ratings for selected global nations
Sub-Saharan Africa remained the least stable region with an average CSI internal stability score of 2.43 in Q2 2026 (Q1: 2.41 – moderate risk). The overall internal risk profile was largely unchanged across other regions with Europe remaining the most stable region (Q2: 1.09 – low risk).
The largest deteriorations in overall internal stability risk were recorded in Bahrain, Niger, South Africa, Kuwait, and Mozambique. Bahrain rose from 1.54 to 1.78 (low risk); Niger rose from 2.55 to 2.80 (high risk); South Africa rose from 2.21 to 2.42 (moderate risk); Kuwait rose from 1.43 to 1.58 (low risk); and Mozambique rose from 2.88 to 3.02 (high risk).
These cases indicate that worsening internal stability risk was not confined to active conflict environments. It also reflected to varying degrees economic stress, political fragility, governance pressure, and social strain.
In Bahrain, the increase in internal stability risk reflected the interaction of external disruption and domestic fiscal constraint. Oil revenue accounted for 9.7% of government revenue in 2025, well below the GCC average, according to IMF data. However, Strait of Hormuz disruption and attacks against domestic infrastructure in Q2 2026 still raised economic risk by weighing on confidence, trade, and hydrocarbon-linked activity. The pressure exposed Bahrain’s constrained fiscal position, high public debt, and persistent deficit, increasing risk perceptions around the state’s capacity to absorb economic pressure and meet domestic expectations.
Kuwait’s deterioration was more directly linked to hydrocarbons. Oil revenue accounted for 47% of state revenue in 2025, according to IMF data. Strait of Hormuz disruption and attacks against infrastructure during Q2 2026 curtailed oil production and exports, raising fiscal and economic risk despite Kuwait’s substantial reserves, limited debt, and historic fiscal surplus. The risk movement was partly mitigated by subsequent recovery in output: Kuwaiti crude production reached 1.97 million barrels per day in July, up from 1.65 million barrels per day in June and 0.58 million barrels per day in May. A continuation in Q3 2026 of such oil exports will very likely mean Kuwati’s economic risk score improves in the short-term.
Niger’s deterioration reflected compounding internal and external pressures. The CSI movement from 2.55 (moderate risk) to 2.80, within the high-risk band, was consistent with worsening fiscal and external-balance pressures interacting with continued military-rule consolidation, constrained political space, insecurity, and limited state capacity.
South Africa’s CSI deterioration, from 2.21 to 2.42 within the moderate-risk band, reflected weak labour-market conditions, inflation pressure, and GDP volatility. These factors intensified household stress and contributed to greater social and political risk. Anti-migrant demonstrations during the quarter were a visible manifestation of wider socio-economic grievances linked to unemployment, inequality, and cost-of living pressures.
Mozambique’s movement from 2.88 to 3.02, into the high-risk band, was driven primarily by economic degradation. The Q2 deterioration reflected compound stress from subdued growth, persistent foreign-exchange shortages, fiscal and debt vulnerabilities, flood-related disruption to agriculture and infrastructure, high food prices, and higher imported fuel and fertiliser costs.
Improved outlook
The largest improvements in overall internal stability risk reduction were recorded in Syria and Iran. Syria's overall stability score improved from 3.90 to 3.40, moving from very high risk to high risk. Iran improved from 2.95 to 2.67, remaining in the high-risk band. In both cases, the improvement reflected reduced immediate political and social stability pressure rather than a structural reduction in underlying risk.
Iran’s improved outlook was driven primarily by reduced protest activity. Nationwide protests occurred on a large-scale from late 2025 into early 2026, linked primarily to economic malaise and demands for political reform. The state’s response reduced near-term protest momentum, while the rally-to-the-flag effect following US and Israeli attacks since February 2026 lowered immediate political and social stability risk. Janes also assesses that the threat to the Iranian government from protests and riots as of Q2 2026 is lowered by the lack of leadership and organisation among protesters in Iran, the failure of Reza Pahlavi to rally Iranians to a broader policial opposition movement, the lack of any on-the-ground signs of coordinated political opposition, relatively strong elite cohesion at the top of the Iranian government and the loyalty of the security forces, alongside the exigencies of wartime government measures.
Syria’s improvement was driven mainly by lower social risk, particularly armed-group and protest risk, with economic and political risks also easing. The movement reflected tentative consolidation of the post-Assad transition. The interim government advanced institutional appointments and elections in areas previously outside central control, while integration of the Kurdish-led Syrian Democratic Forces and the Democratic Autonomous Administration of North and East Syria into state institutions continued.
The improvement does not indicate normalisation. Syria’s risk level remained materially higher than immediately before Assad’s ouster, when the country was rated 2.93, high risk, in Q3 2024. This indicates that the post-transition trajectory had improved in Q2 2026 but remains exposed to institutional weakness, armed-group fragmentation, and renewed political instability.
External risk
| Rank | Country | Q1 2026 external conflict stability rating | Q2 2026 external conflict stability rating | % change (quarter on quarter | Q2 2026 risk interpretation |
| 1 | Yemen | 1.87 | 2.98 | 0.59 | High risk |
| 2 | Oman | 0.53 | 1.34 | 1.51 | Low risk |
| 3 | Bahrain | 2.07 | 2.49 | 0.21 | Moderate risk |
| 4 | Saudi Arabia | 2.11 | 2.49 | 0.18 | Moderate risk |
| 5 | Kuwait | 2.49 | 2.83 | 0.14 | High risk |
| Source: Janes (Country Stability Indicators) | |||||
The most significant deterioration relating to conflict risk was concentrated in the Gulf and linked to the US-Iran conflict. This measure captures the extent to which conflict is expected to act as a destabilising factor, rather than simply the probability of conflict occurring.
The largest increases were in Yemen (2.98 - rising from moderate to high risk), Oman (0.53 to 1.34 - low risk), Bahrain (2.07 to 2.49 - moderate risk), Saudi Arabia (2.11 to 2.49 - moderate risk), and Kuwait (2.49 to 2.83 – high risk).
The changes increased the Middle East regional average external-conflict risk score by 8%.
The increase in external conflict risk relating to Yemen in the second quarter related to the resumption of cross-border escalations after the 2022 ceasefire, with Ansar Allah missile and UAV attacks on Abha International Airport in Saudi Arabia and reported Saudi or Yemeni Presidential Leadership Council (PLC)-linked strikes on Sana’a International Airport raising the destabilising effect of the conflict on Yemen’s socio-political stability.
Country case studies
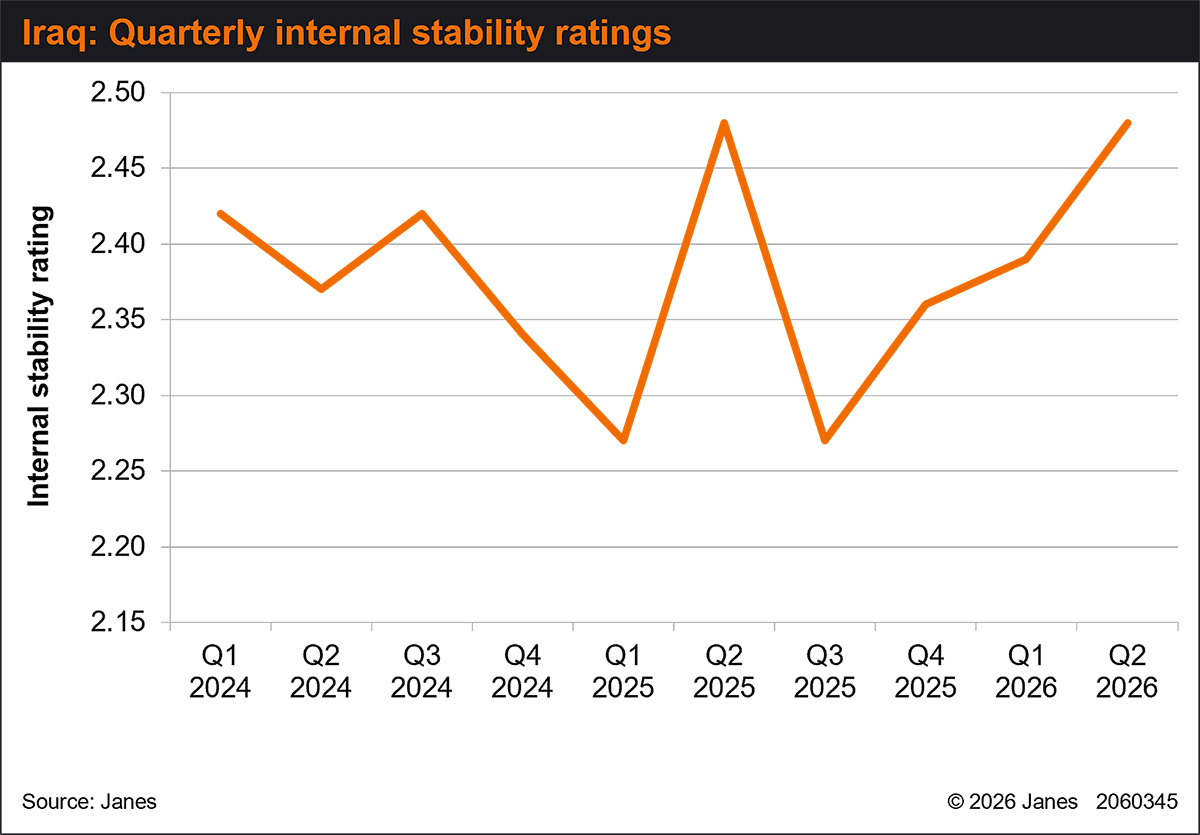 The overall internal stability ratings of Iraq from the first quarter of 2024 to the second quarter of 2026. From Country Stability Indicators. Image credit: Janes
Iraq’s overall internal risk score increased from 2.39 to 2.48 between Q1 and Q2 2026, remaining within the moderate risk band. The movement reflected a deterioration in economic risk that offset a modest improvement in the political environment.
As with other Gulf oil exporters, Iraq was exposed to economic and fiscal disruption following the start of the US- and Israel-led conflict with Iran in late February 2026. Its vulnerability was higher than most regional peers because hydrocarbons accounted for about 90% of government income in 2025, according to the IMF, and because fiscal buffers were limited.
Iraq’s oil exports declined substantially after the outbreak of the US-Iran conflict in February 2026. Janes’ April 2025 MENA Energy Tracker had modelled Iraq’s fiscal trajectory under prolonged Strait of Hormuz restrictions, identifying substantial government revenue loss across 2026 if crude exports continued to be disrupted. Subsequent export data were consistent with that risk pathway.
Indeed, Iraq’s Ministry of Oil reported that exports in May and June 2026 were around 32.1 million barrels per month, compared with 100 million barrels in February 2026.
The fiscal impact has been substantial. On 4 August 2026, ‘The National’ reported that Iraq had not paid July salaries to many public employees and that oil revenue had fallen from USD6.8 billion in February 2026 to about USD2.3 billion in May and June. The same report stated that the central government spends about USD6.5 billion per month on salaries, pensions, and social welfare.
The loss of crude-oil revenue therefore indicates increased deficit risk and a higher probability of domestic instability if the central government cannot maintain wage, pension, and welfare payments in the short-term (next six months).
For more information, please visit: Economic risk drove second-quarter stability deterioration and is likely to remain the primary risk vector in the second half of the year